|
Creating a New Dashboard
|   |
|
Creating a New Dashboard
| |
To create a new dashboard, the first thing you will need to become familiar with is the coordinate plane. Once you understand how the coordinates and values work, you are ready to start adding objects.
The inventory of objects on your dashboard is managed in the Dashboard Object View window at the lower left of the application. In this window, you are able to add, delete, copy, paste, and order your objects. You can also organize your objects using layers and containers. For more information about these functions, click here.
To add an object, right-click on an object or layer in the Dashboard Objects View window. Hover over "Add Object" and a list of objects will appear. Make your selection from this list and the object will be added in its default settings. Next, to edit the object, be sure the object is highlighted in the Dashboard Objects View window. In the Dashboard Object Properties window on the lower right, you can customize it to exactly what you want. Below is a list of objects and quick descriptions. Click on an object's name to learn more about its properties and how to edit it.
|
|
Lines are very useful when designing tick marks and needles. Each line has a pen and a brush (an outline and a fill) that allow the line to change thickness from one point to another or become dashed around the outside. You can also add gradients to the line to make them more 3-dimensional. |
|
|
|
Ellipses are the most general shape for a gauge. Using ellipses, you can create a 3-dimensional frame and background of the gauge. This object is great for any circular shape you want on your dashboard. |
|
|
|
Rectangles are often used to outline text. Like the ellipes, they also make great gauge backgrounds. |
|
|
|
Rounded rectangles are a softer looking form of the rectangles, with one major difference: the rounded edges can be modified to become more or less round using a radius function. |
|
|
|
This object is great for adding color bands to your gauge. |
|
|
|
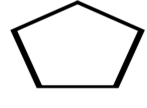
With the polygon object, you can create any shape you desire using straight lines. |
|
|
|
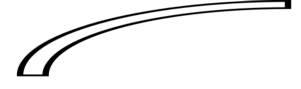
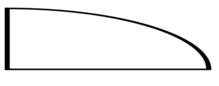
This curve uses a starting point, an end point, and two other reference points to shape it into the curve you desire. |
|
|
|
You can use a picture or icon from your own files to personalize your dashboard. |
|
|
|
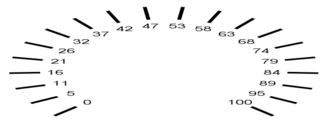
What would a gauge be without tick marks? Everything about the tick marks is also fully customizable. |
|
|
|
You can add a text string to label your gauge with a multiplier or link it to an OBD-II value. |
|
|
|
The needle object is actually a container, which allows you to customize it with any combination of objects. |
|
|
|
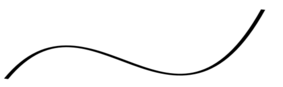
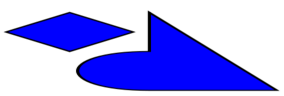
A path object can actually be separated into multiple objects (like the example shown) but can still be treated as one. You can use curves or straight lines on a path. |
|
|
|
The pie wedge can be modified to take up any or all of the ellipse. |
Other objects that hold the above mentioned objects: