|
Path Gauge
|   |
|
Path Gauge
| |
|
|
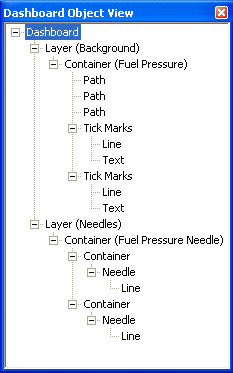
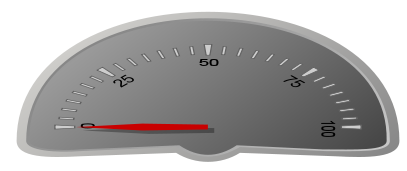
This gauge illustrates an example of using a path object as the shape of your gauge. The three paths combine to form a 3-dimensional frame. Another feature of this example is the larger tick marks. Instead of lines, these tick marks are drawn by triangles by using a width list in the line object below the tick marks There is also a needle "shadow" on this gauge. This is done by offsetting the container with the needle. The first needle container gives the properties for this. The Dashboard Object View window at the left is a good example of grouping objects by layers and containers. Many are also labeled. (You can label a layer or container by typing in the Description box in the Dashboard Object Properties window.) |
|
OBJECT |
PROPERTIES |
|
Container |
(Default Options) |
|
Path |
move_to(35, 35); curve_to(35, 10, 65, 10, 65, 35); curve_to(65, 37.5, 62.5, 37.5, 60, 37.25); line_to(52.5, 36.75); curve_to(51, 38.5, 49, 38.5, 47.5, 36.75); line_to(40, 37.25); curve_to(37.5, 37.5, 35, 37.5, 35, 35); close_path();
[100, (136, 136, 136), 255] |
|
Path |
move_to(35.75, 35); curve_to(35.75, 11.25, 64.25, 11.25, 64.25, 35); curve_to(64.25, 36.75, 61.75, 36.5, 59.25, 36.5); line_to(52.5, 35.9); curve_to(50.75, 37.75, 49.25, 37.75, 47.5, 35.9); line_to(40, 36.5); curve_to(38.25, 36.75, 35.75, 36.5, 35.75, 35); close_path();
[100, (199, 199, 199), 255] |
|
Path |
move_to(36, 35); curve_to(35.75, 11.75, 64.25, 11.75, 64, 35); curve_to(64, 36.5, 61.5, 36.25, 59, 36.25); line_to(52.25, 35.65); curve_to(50.75, 37.5, 49.25, 37.5, 47.75, 35.65); line_to(40, 36.25); curve_to(38.5, 36.5, 36, 36.25, 36, 35); close_path();
[100, (69, 69, 69), 255] |
|
Tick Marks |
|
|
Line |
|
|
Text |
(Default Options) |
|
Tick Marks |
|
|
Line |
|
|
Text |
(Default Options) |
|
Container |
(Default Options) |
|
Container |
|
|
Needle |
|
|
Line |
|
|
Container |
(Default Options) |
|
Needle |
|
|
Line |
|